
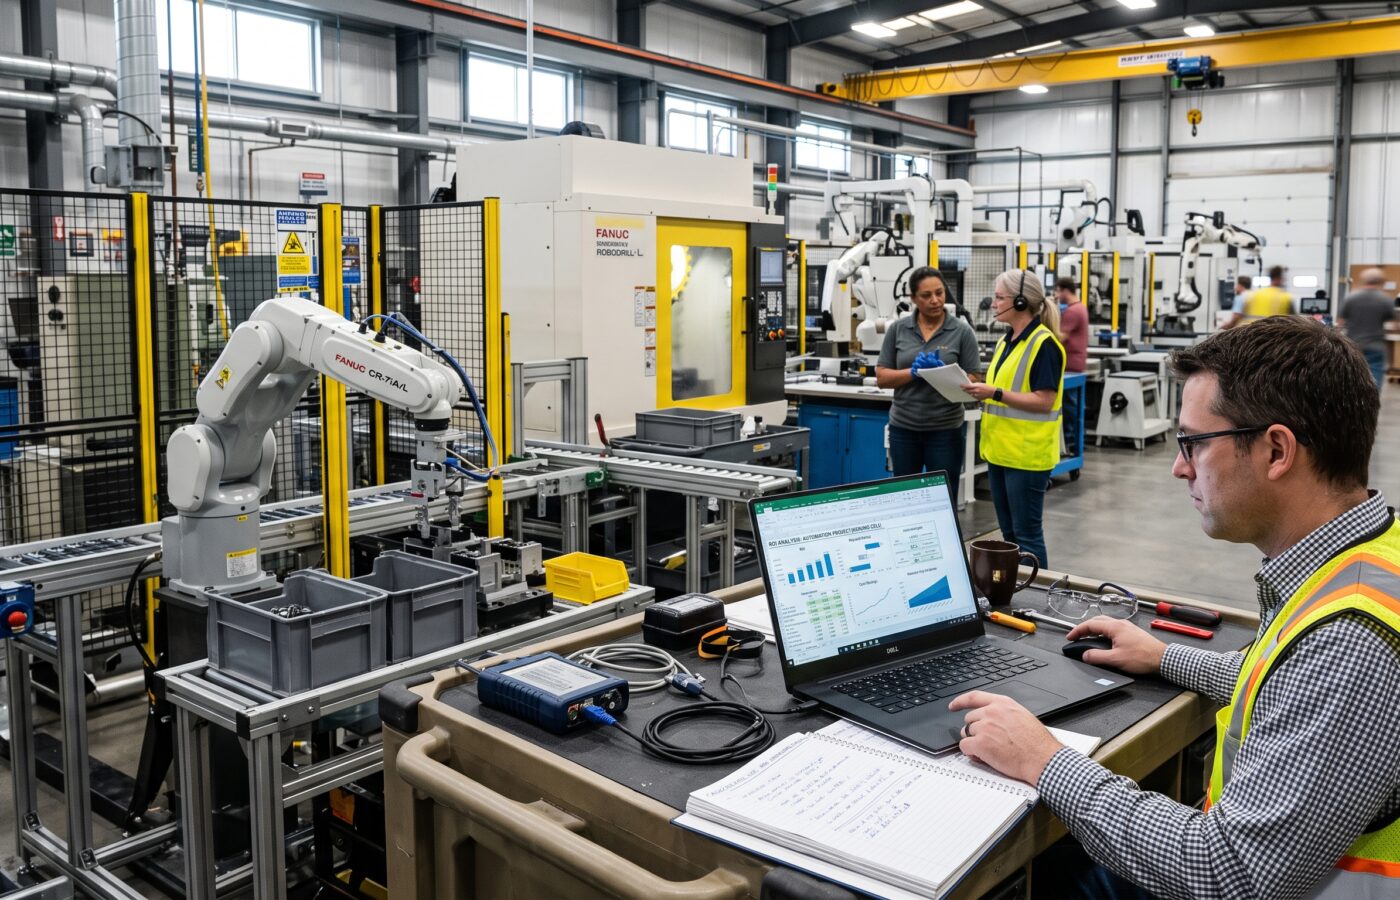
Calculating the Real ROI of Manufacturing Automation

Calculating the real manufacturing automation ROI requires moving beyond simple headcount reduction to account for hidden implementation costs, scrap reduction, and throughput gains. When plant managers and finance directors evaluate six or seven-figure investments, relying on generic sales decks or surface-level labor savings leads to costly surprises down the road. To get an accurate financial picture, manufacturers must establish an honest operational baseline and account for the full lifecycle costs of their equipment.
It’s a fair question. Few people answer it well. Vendors have an incentive to make the payback period look short. Plant managers have an incentive to make the case sound airtight so leadership approves the capital request. The actual return sits somewhere between those two motivated numbers, and finding it takes real work.
Here’s how I actually build these numbers when I sit across the table from a client. This is the version I’d want if I were the one signing off on a six or seven figure purchase.
Why ROI Conversations Go Wrong on the Plant Floor
The most common mistake treats manufacturing automation ROI as a single number. Someone calculates it once and then forgets about it. In reality it shifts constantly. Labor costs change, order volume fluctuates, and the equipment itself ages.
Scope causes the second most common mistake. Many ROI calculations only weigh the machine purchase price against expected labor reduction. That’s a start, but it skips a lot. Most of these calculations leave out programming time, integration with existing controls, downtime during commissioning, operator training, ongoing maintenance contracts, spare parts inventory, and software licensing. I’ve audited ROI projections built by other integrators and by internal engineering teams. The gap between the projection and the number that shows up eighteen months later almost always traces back to something left off the original spreadsheet. The automation itself rarely underperforms.
The Value Story Runs Deeper Than Labor
A third mistake is more subtle. Plenty of people assume automation only creates value through direct cost reduction. Some of my biggest client wins had almost nothing to do with headcount. They came from quality consistency, reduced scrap, and faster changeover times. One client landed a contract that required tighter tolerances than their manual process could reliably hit. A model with only one line item for labor saved will undervalue any project that pays for itself through a different mechanism entirely.
Start With the Real Baseline, Not the Sales Deck Numbers
Before I discuss what a robot cell or a vision guided conveyor system will save a client, I ask them to help build an honest baseline. This sounds obvious, but plants skip it constantly. The data usually isn’t organized cleanly enough to make it easy. Every manufacturing automation ROI number traces back to this baseline, whether anyone realizes it or not.
I need actual cycle times, not the number written on a process sheet five years ago. Break scrap and rework rates out by shift. A process that looks fine on day shift and falls apart at night tells you something important about where automation will actually help. Unplanned downtime hours need to tie to the specific process under consideration, not a plant wide average. A plant wide number dilutes the picture and hides where the real problem lives. The labor cost has to be real too. Overtime, shift differentials, and the fully loaded cost of an employee, once benefits and payroll taxes come into it, all belong in that number. The wage on a pay stub alone won’t get you there.
Clients are sometimes surprised by how much time this baseline work takes. It happens before equipment even enters the conversation. Every dollar of projected savings traces back to a number in this baseline. A soft baseline produces a soft projection every time.
The Costs Nobody Puts in the Spreadsheet
Once the baseline holds up, the next step builds an honest cost ledger. I split this into three buckets. Getting this part right is where most manufacturing automation ROI numbers either hold up or fall apart. Lumping everything under capital cost is exactly how surprises happen later.
Capital Cost
This bucket includes the equipment itself, controls, and safety systems. It also covers facility work like new electrical service, compressed air capacity, or floor reinforcement. Most sales quotes lead with this number. It’s usually accurate as far as it goes.
Implementation Cost
This is where I see the most underestimation. Programming, integration with existing PLCs or an MES layer, commissioning time, and validation testing all belong here. Say the line comes down for two weeks during installation. That lost production counts as a real cost, even though nobody ever cuts an invoice for it. Some clients push back on including this because it makes the project look less attractive on paper. Leaving it out doesn’t make the cost disappear. It just means the team discovers the true payback period the hard way, after the fact, instead of planning for it up front.
Ongoing Cost
Manufacturers forget this bucket most often. Preventive maintenance contracts belong here. So does spare parts inventory for specialized equipment, software licensing and updates, and training every time a new operator or technician comes on board. None of this is exotic. It’s just easy to leave off a one time capital justification, even though it runs for the entire life of the equipment.
Labor Savings Are Real, But They’re Not the Whole Story
Labor savings deserve credit. Finding and keeping skilled machine operators has gotten genuinely difficult in many markets right now. Labor still carries the biggest single line item in most manufacturing automation ROI calculations, and it should.
A nuance matters here, though. Automation rarely eliminates a position outright the way a simple spreadsheet implies. More often I see redeployment. The person who used to manually load a machine now oversees three automated cells. Someone else moves into a quality check role or a maintenance role that didn’t exist before. That’s still a real efficiency gain, and it still belongs in the model. But the accounting differs from a straight headcount reduction. Say a client counts on eliminating four positions and only eliminates one, while redeploying the other three. The model needs to reflect redeployment value, not three vanished salaries.
Automation also adds a labor cost rather than removing it, and I flag this for every client up front. Skilled technicians who maintain and troubleshoot automated equipment cost more per hour than the operators they replace. In many markets right now, those technicians are harder to find than the plant expects. That cost belongs in the model too.
Throughput and Quality Metrics That Actually Move the Needle
Some of the most financially significant automation projects I’ve worked on had a payback story with almost nothing to do with labor. These wins rarely show up in a narrow manufacturing automation ROI model built only around headcount.
One metal fabrication client installed an automated welding cell that didn’t reduce headcount at all in year one. The cell increased throughput enough that the shop could finally take on a contract they’d previously turned down. Their manual process couldn’t hit the required volume at acceptable quality. That single new contract paid for the automation faster than any labor savings calculation would have predicted. A labor only model would never have justified that project, and it would have been the wrong call.
Quality Gains Show Up on the Material Line
Quality and scrap reduction work the same way. A vision inspection system added to an existing line might not save a single labor hour. Say it catches defects before they reach a customer and drops a scrap rate from four percent to under one percent. Material savings alone can justify that investment, especially with raw material costs where they’ve been. I ask every client to pull scrap cost per unit and multiply it against volume before we even discuss equipment. That number is frequently bigger than expected.
One Metric Captures the Whole Picture
Overall equipment effectiveness combines availability, performance, and quality into a single composite metric. It’s the best tool I know for capturing all of this at once, rather than treating labor, throughput, and quality as three separate arguments. A client’s OEE might move from the low 60s into the high 70s or 80s as a result of an automation project. That number does more to justify the spend than any labor table, because it reflects the whole picture together.
Payback Period: What’s Realistic in 2026
Clients ask constantly what a normal payback period looks like. I understand the instinct to want a benchmark. This is usually the number leadership fixates on most in any manufacturing automation ROI conversation. The honest answer depends heavily on the application.
Simple, well defined tasks like palletizing, packaging, or repetitive material handling tend to produce the shortest, most predictable payback periods. Twelve to twenty four months is common when labor costs and shift counts support it. More complex integrations stretch that timeline further, sometimes to three or four years. Custom tooling, vision systems, and connections to legacy equipment all add time. That’s not a red flag. It’s just a reflection of complexity.
A longer payback period isn’t automatically a worse investment. Equipment with a service life of ten or fifteen years changes the math entirely. A project with a three year payback and a twelve year useful life looks very different from one with a three year payback and a five year useful life. Too many ROI conversations flatten that distinction into a single payback number that doesn’t tell the whole story.
How Financing and Depreciation Change the Picture
The purchase price rarely reflects what a project actually costs a manufacturer in year one. Financing structure and tax treatment both move the real number, sometimes by a wide margin. None of this shows up in a simple manufacturing automation ROI spreadsheet built around labor and machine cost alone.
A cash purchase and a lease produce very different cash flow pictures, even when the equipment and the labor savings look identical on paper. Leasing preserves working capital, but it usually costs more over the equipment’s full life. Buying outright, or financing through an equipment loan, often costs less over time, though it ties up capital a plant might need elsewhere. I ask every client which one matters more to their business this year, because the answer changes which financing path actually makes sense.
Depreciation matters just as much. Accelerated depreciation schedules and equipment specific tax incentives can pull years of tax benefit into the first year or two of ownership, which shortens the effective payback period considerably. I’ve seen clients discover, after finance ran the real numbers, that a project they’d shelved as too expensive actually paid back a full year faster once depreciation entered the model. I’m not a tax advisor, and neither is most of the engineering team building the technical case. This is exactly why the finance team needs a seat at the table early, before anyone locks in the equipment specification. Bringing them in during the baseline stage, rather than at final approval, tends to produce a far more accurate payback number.
A Simple Framework I Use With Clients
I don’t believe in overcomplicating this process. Here’s the sequence I walk every client through, whether we’re discussing a single robotic cell or a multi million dollar line overhaul.
First, build a true baseline from real production data, not process sheet assumptions. Second, itemize capital, implementation, and ongoing costs separately so nothing slips through the cracks. Third, identify every value driver, not just labor. Throughput gains, scrap reduction, quality improvements, safety incident reduction, and new capacity all count. Fourth, calculate payback period and net present value using the plant’s actual cost of capital. Skip the generic rate pulled from a template. Fifth, stress test the model against a slower than expected ramp up, because commissioning rarely goes exactly to schedule.
That fifth step matters more than clients expect. I push back when someone wants to skip it. I’ve watched leadership approve projects on best case numbers and then label them disappointments a year later, even when the actual performance was solid. It just didn’t match an overly optimistic projection that nobody stress tested going in.
Common Mistakes That Kill ROI Calculations
A few patterns show up again and again when I review someone else’s automation business case.
Using vendor supplied cycle times without validating them ranks near the top. A robot arm rated for a certain cycle time on a demo part, running in a controlled environment, will almost never hit that exact number on a real production floor. Real part variation gets in the way.
Ignoring ramp up time causes similar damage. Nobody hits full production rate on day one after commissioning. Operators need to learn the new process, and programs need fine tuning. Engineers still need to work out part variation issues too. A model that assumes full rated throughput starting in month one sets the project up to look like it’s underperforming when it’s actually on track.
Currency and material cost volatility trip up more projects than they used to. Imported equipment and components with volatile pricing carry the most risk here. A calculation built on a quote from eight months ago can be meaningfully off by the time the equipment ships.
Treating the ROI calculation as a one time exercise causes the last major mistake. I encourage every client to revisit actual performance against the model at the ninety day mark. Check again at the one year mark, and then annually after that. The goal isn’t assigning blame if the numbers moved. That comparison is exactly how a team gets better at building the next projection.
Bringing It to Leadership: How to Present the Numbers
Part of my job, official or not, involves helping engineering and operations teams translate this work into something finance will actually approve. A few habits consistently help.
Present a range instead of a single number. A payback period described as eighteen to twenty six months, depending on ramp up speed, reads as more credible to a CFO than one confident figure. It signals a stress tested model rather than an optimized one.
Separate hard savings from soft savings clearly. Labor and material cost reduction count as hard savings. Improved safety, better retention, and capacity for future growth are real but softer. Blending them together tends to make the whole case look less rigorous than it actually is.
Tie the request back to strategic goals beyond the immediate project. Say a plant needs a new certification or tolerance level to win business. State that explicitly rather than burying it inside a throughput line item. Leadership responds to strategic framing more than a spreadsheet alone.
Where This Leaves Manufacturers Today
Manufacturing automation ROI isn’t a fixed formula that someone junior can run and hand back with a reliable answer. It demands an honest baseline. It demands a complete accounting of costs across the equipment’s full life. And it demands a value story that reaches beyond labor reduction into throughput, quality, and strategic capacity. The manufacturers who get the most from their automation investment aren’t the ones with the most optimistic projections going in. They’re the ones who built a model honest enough to survive contact with an actual production floor. Then they kept checking it against reality once the equipment started running.
If you’re building a business case right now, slow down on the baseline. Be ruthless about itemizing every cost bucket. Don’t let labor savings carry the entire argument when a stronger, more complete story sits in your throughput and quality data.
Frequently Asked Questions
What is a good ROI percentage for manufacturing automation?
No single universal benchmark exists. The right target depends on the application, the industry, and a manufacturer’s cost of capital. Many manufacturers aim for a payback period under three years. Longer payback periods can still make sense for equipment with a long useful life. Deloitte’s manufacturing industry research offers useful context on how manufacturers currently prioritize automation investment. Deloitte 2026 Manufacturing Industry Outlook
How long does it typically take for manufacturing automation to pay for itself?
Straightforward applications like palletizing or material handling often pay back in twelve to twenty four months. More complex, custom integrated systems often take three to four years. Labor costs, shift structure, and how much custom engineering the process requires all shape the right timeframe.
What costs are most often left out of manufacturing automation ROI calculations?
Manufacturers most often underestimate implementation costs like programming, commissioning, and production downtime during installation. They also commonly leave ongoing costs, such as maintenance contracts, spare parts inventory, software licensing, and technician training, off the initial business case. Those costs continue for the life of the equipment whether anyone plans for them or not.
Does manufacturing automation ROI only come from labor savings?
No. Throughput gains, scrap and quality improvements, safety incident reduction, and the ability to win business that requires tighter tolerances or higher volume all count as legitimate value drivers. In some projects they matter more than direct labor reduction. The Association for Advancing Automation tracks broader industry trends on why manufacturers adopt automation beyond pure labor substitution. A3 Market Intelligence
How can a plant improve the accuracy of its manufacturing automation ROI projections?
Start with a real production baseline instead of process sheet assumptions. Itemize capital, implementation, and ongoing costs separately, and stress test the model against a slower than expected ramp up period. Reviewing actual performance against the original model at ninety days and one year also sharpens the accuracy of future projections. CSIA’s project planning resources offer additional guidance on structuring an automation business case. CSIA Manufacturing Automation Project Guide via Automation World
References
- Deloitte Insights. “2026 Manufacturing Industry Outlook.” Deloitte, 2026. https://www.deloitte.com/us/en/insights/industry/manufacturing-industrial-products/manufacturing-industry-outlook.html
- Deloitte Insights. “2025 Smart Manufacturing and Operations Survey: Navigating Challenges to Implementation.” Deloitte, 2025. https://www.deloitte.com/us/en/insights/industry/manufacturing/2025-smart-manufacturing-survey.html
- McKinsey & Company. “Automation and the Talent Challenge in American Manufacturing.” McKinsey & Company. https://www.mckinsey.com/capabilities/operations/our-insights/automation-and-the-talent-challenge-in-american-manufacturing
- Control System Integrators Association, via Automation World. “Manufacturing Automation Project Guide: 9 Essential Steps from Discovery to Success.” Automation World. https://www.automationworld.com/control/article/55307156/control-system-integrators-association-csia-manufacturing-automation-project-guide-9-essential-steps-from-discovery-to-success
- Association for Advancing Automation (A3). “Market Intelligence.” Automate.org. https://www.automate.org/market-intelligence